What if the data volume is too big to process by our own team?
Next to the geo-referenced point cloud generation, the classification came. “The first step is the initial classification using macro algorithm to run automated processing, like batch-oriented computation.” Jane continued. It was another experience talk for optimizing diverse algorithms suited to different types of terrain, like ground, vegetation, building, etc. When an appropriate algorithm has been applied, considerable manual efforts would be gone. Rian raised his hand, “So, you mean the algorithm cannot tell all the points correctly and further check is needed to evaluate the initial classified result?” Then, Jane responded to the 2 trainees, “Bingo! The following step is intensive classification which requires our patience to find those wrongly classified points and restore what they are supposed to be. Only in this case can we obtain highly accurate digital elevation model and contours.” More deep understandings of the software functions and actual environment were delivered to them while they concentrated on the manual interventions with the problematic portions. “It’s a bit time-consuming compared with the earlier steps, but we come to realize how laser point cloud present the 3D scenes with a variety of display modes and section views.” Axel commented on this issue. After the intensive classification, the ground point density reached a total of 19 points per square meter (see Fig. 9), which could satisfy the 1:500 scale mapping requirement as expected. Upon quite a number of detailed corrections, the point cloud was adjusted to what it should be and therefore ready for digital elevation model (see Fig. 10) generation and contour lines export.
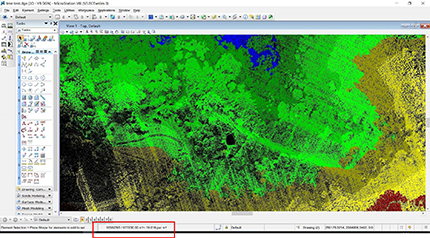
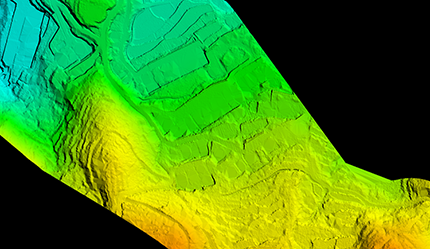
(Fig. 9, ground point density statistics) (Fig. 10, the generated digital elevation model)
The last but not least step went to the vectorized mapping, a very demanding procedure. The software Z-Lab Mapper became their workmate of feature extractions in the way of lasergrammetry and they vectorized the both ground features and terrain features like houses, bridges, roads, electric poles, ridges, farms, etc. (see Fig. 11) “It helps us to vectorize the points, lines and polygons in the 2D way but interacts with us in the 3D point cloud at the same time. We might refer to the existing outputs like DSM, DEM, point cloud and orthophoto (see Fig. 12) respectively and extract the features in compliance with 3D point cloud and different model presentations. Sometimes CAD or MicroStation platformed software kits would be a nice supplementary tool.” Jane showed them hand on hand with every single detail. “The process of vectorizations is really labor-intensive, though already semi-automated, we still have to do it one by one. It’s not fun at all, and I am just wondering what if the data volume is too big to process by our own team?” Axel mentioned their misgiving, which could be the same headache to other LiDAR survey teams. Jane smiled and spoke to them, “It’s true that vectorized mapping seems comparatively strenuous. That’s why we have specialized teams to take care of each session, then each team could focus on what they are really good at. And that’s the way to push improvements from repetitive work. On the other hand, data processing service is available from our side, so you may just send the captured data to us and relax. We are sure our solid background and abundant experience in plenty of field-to-office survey services would certainly bring you quality deliverables.” Apparently, Jane’s statement direct put forth a remedy that features feasibility and practicality for all those buyers short of capable or experienced staff.
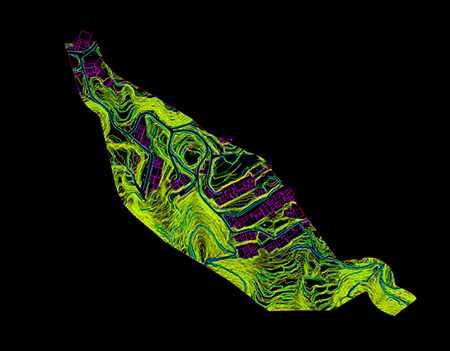
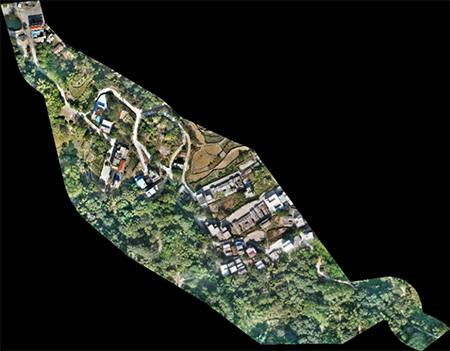
(Fig. 11, part of the vector line map with contours) (Fig. 12, part of the orthophoto map)
A picture is worth a thousand words. And likewise, there’s nothing better than an actual project case, or even more, in LiDAR training. The 9-day in-job training came to a close with a productive conclusion, as the 2 lovely visitors were able to experience themselves a complete workflow from field to office. “The project-based learnings (see Fig. 13) meant a lot more than the tedious user manuals or quick guidebooks. Instead, the beloved mentors showed us the ropes with some situational approaches and methodical guidance. It’s pretty impressive to see how the Z-Lab team accomplish a job service and follow their steps (see Fig. 14) to acquire as many know-hows as possible! I believe that their wonderful delivery of knowledge would be very helpful for our systematic command of this new subject.” Axel and Rian couldn’t agree more on this point of view. Being a system solution, LiDAR now enjoys a revolutionary way of training with a steep learning curve. The insights from the actual case with specific requirements and conditions would help to quickly isolate and address problems in buyer’s future work, according to the Z-Lab team.
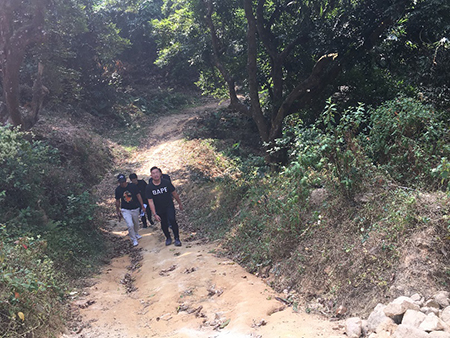
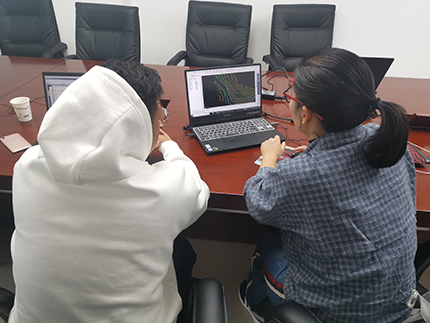
(Fig. 13, doing site visit with the team…) (Fig. 14, showing the tips of vectorized mapping by Jane…)
Click http://www.southinstrument.com/video/lists.html?v_id=28&sol_tid=6 for the video story.


